
Page 22 - Hispanic Market Guide 2022
P. 22
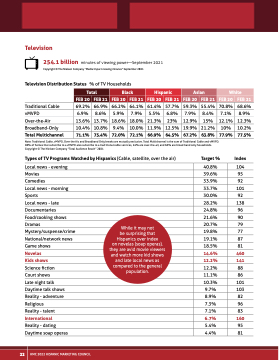
Television 254.1 billion minutes of viewing power—September 2021 Copyright © The Nielsen Company “Media Impact viewing minutes” September 2021 Television Distribution Status Traditional Cable vMVPD Over-the-Air Broadband-Only Total Multichannel % of TV Households Total Black Hispanic Asian White FEB 20 FEB 21 FEB 20 FEB 21 FEB 20 FEB 21 FEB 20 FEB 21 FEB 20 FEB 21 69.2% 66.9% 66.2% 64.1% 61.4% 57.7% 59.3% 55.4% 70.8% 68.6% 6.9% 8.6% 5.9% 7.9% 5.5% 6.8% 7.9% 8.4% 7.1% 8.9% 13.6% 13.7% 18.6% 18.0% 21.3% 23% 12.9% 15% 12.1% 12.3% 10.4% 10.8% 9.4% 10.0% 11.9% 12.5% 19.9% 21.2% 10% 10.2% 71.1% 75.4% 72.0% 72.1% 66.9% 64.5% 67.2% 63.8% 77.9% 77.5% Note: Traditional Cable, vMVPD, Over the Air, and Broadband Only breaks are mutually exclusive. Total Multichannel is the sum of Traditional Cable and vMVPD. 10% of homes that subscribe to a vMVPD also subscribe to a trad itional cable services, 24% are over-the-air, and 66% are broad band only households. Copyright © The Nielsen Company “Total Audience Reach” 2021 Target % Index Types of TV Programs Watched by Hispanics (Cable, satellite, over the air) Local news - evening Movies Comedies Local news - morning Sports Local news - late Documentaries Food/cooking shows Dramas Mystery/suspense/crime National/network news Game shows Novelas Kids shows Science fiction Court shows Late night talk Daytime talk shows Reality - adventure Religious Reality - talent International Reality - dating Daytime soap operas While it may not be surprising that Hispanics over index on novelas (soap operas), they are avid movie viewers and watch more kid shows and late local news as compared to the general population. 40.8% 104 39.6% 95 33.9% 92 33.7% 101 30.0% 92 28.2% 138 24.8% 96 21.6% 90 20.7% 79 19.8% 77 19.1% 87 18.5% 81 14.6% 460 12.2% 141 12.2% 88 11.1% 86 10.3% 101 9.7% 103 8.9% 82 7.3% 96 7.1% 83 6.7% 160 5.4% 95 4.4% 81 22 HMC 2022 HISPANIC MARKETING COUNCIL
