
Page 17 - Hispanic Market Guide 2022
P. 17
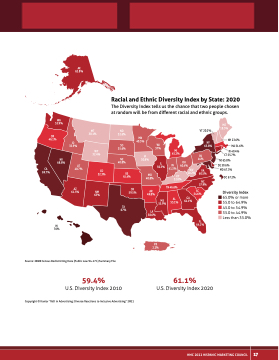
AK 62.8% Racial and Ethnic Diversity Index by State: 2020 The Diversity Index tells us the chance that two people chosen at random will be from different racial and ethnic groups. WA 55.9% ME 18.5% NH 23.6% MA 51.6% RI 49.4% CT 55.7% NJ 65.8% DE 59.6% MD 67.3% DC 67.2% Diversity Index 65.0% or more 55.0 to 64.9% 45.0 to 54.9% 35.0 to 44.9% Less than 35.0% OR 46.1% ID 35.9% UT 40.7% AZ 61.5% MT 30.1% WY 32.4% CO 52.3% NM 63% ND 32.6% SD 35.6% NE 40.8% MN 40.5% IA 30.8% VT 20.2% NY 65.8% PA 44% WV 20.2% 60.5% NV 68.8% WI 37% IL 50.3% MI 45.2% IN 41.3% OH 40.4% CA 69.7% KS MO 45.4% 40.8% VA HI 76% FL 64.1% TX 67% OK KY 32.8% TN 46.6% AL 53.1% NC 57.9% SC 54.6% 59.5% AR 49.8% MS 55.9% LA 58.6% PR 2.2% GA 64.1% Source: 2020 Census Redistricting Data (Public Law 94-171) Summary File 59.4% 61.1% U.S. Diversity Index 2010 U.S. Diversity Index 2020 Copyright © Kantar “I&D in Advertising: Diverse Reactions to Inclusive Advertising” 2021 HMC 2022 HISPANIC MARKETING COUNCIL 17
